To reach statistic significance, at least 10 mice are required. 15 mice are ideal to minimize the individual variation.
C57BL/6, male, 2 months to one year old (2-4 months old is optimal), 3-5 mice are kept in one cage after weaning.
Cleaning solution Note: Clean the chamber and/or objects using 70% ethanol first followed by sterile water (to remove the odor of ethanol). Air dry for 3 min.
Equipment
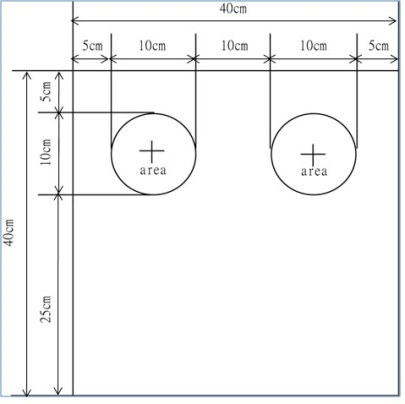
Apparatus Note: The dimensions of plexiglas box is 40 cm x 40 cm x 40 cm. The color of plexiglas is frosted white or transparent. The frosted white plexiglas boxes can diminish the effect from outside views, if the mice have not experienced the open field test.
Figure 1. The apparatus for novel object recognition
Objects Note: The size of objects is 4 cm x 4 cm x 4 cm approximately. The shape of objects is simple like the building blocks. The objects made by wood, metal or hard plastic are preferred, because those are resistant to biting demolition. Because mice are protanope (red color blindness), the colors of objects should be checked by analysis of Vischeck software (a free software available from the website: http://www.vischeck.com) to ensure that mice are able to distinguish them.
Camera/computer Note: The raw data are stored in recording equipment for further analysis. The video tracking system such as “Smart system” (Panlab) can help you to easily get the exploration time of mice to the objects (the heads of mice crossover the object boundary lines indicated in Figure 1). The exploration time can also be counted manually. The results are further analyzed using the Prism (Graph Pad software).
Procedure
Notes:
The novel object recognition test is a non-forced recognition memory test. Any stresses or clues for mice can increase the variability of the results. It is very important to minimize the stimulation from environment and the objects and to make mice acclimating.
Before testing, one pingpong ball is put into the home cage for a week to decrease mice’s stress induced by novel object.
If the mice have not been subjected to any test, transfer them in an empty cage for 5 min per day for at least 3 days to reduce their stress responses in the future task.
The plexiglas boxes and objects are cleaned by cleaning solutions and air-dried for 3 min before usage.
The entire exploration process of mice is recorded using camera and stored in computer.
Day 1-2: Habituation
Mice are first transported to preparing area, which is a place near for the operative space for 10 min.
Then the mice are put into the apparatus for analysis for 10 min to
acclimate the manipulations and environment for decreasing their stress.
This procedure is carried out for two days.
Day 3: Training day
Similar to Day 1 and 2, mice are first transported to preparing area, which is a place near for the operative space for 10 min.
Two identical objects are placed in the plexiglas boxes as indicated in Figure 1 for mice to explore for 10 min.
Day 4: Testing day
All the processes are the same as the Day 3, except that one of old objects is randomly replaced with a new different object (Video 1).
Video 1. Novel object
Analysis
The exploration time is counted by the period that mice stay on the circle area indicated in Figure 1.
If the total of exploration time is less than 20 sec, mouse is likely under the stress. The data should be excluded.
If the total of exploration time is more than 5 min, the recorded film
needs to be checked by person. For instance, mouse may stand on the
object or grooms on the circle area. The result should also be excluded.
The preference rates are measured by dividing the total
exploration time by the time to explore object. The formula to calculate
the object preference is: the preference % = time to explore the
individual object / total exploration time to objects x 100%.
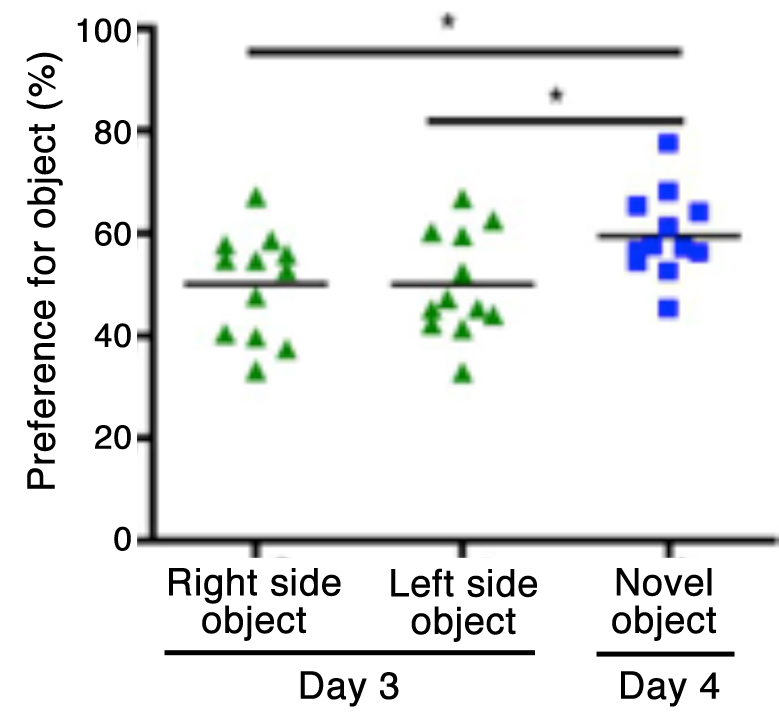
An example of novel object recognition is shown in Figure 2. At Day 3,
the exploration times for two identical objects are similar (around
50%). At Day 4, animals show higher preference to the novel object. The
mean of preference to the novel object is higher than 50% (~60% is
commonly found). The one-way ANOVA using Prism is used for statistic
analysis.
Figure 2. The object preference at Day 3 and Day 4 of wild-type mice (*P < 0.05)
Acknowledgments
This protocol was adapted from previous works listed in the references.